
Teacher Stuff
The Water Lab sets the scene for real water science investigations with sophisticated equipment, open student led challenges and strong links to local water issues and sustainable water use. It is designed to meet the needs of the Science Syllabus e.g. inquiry based learning, science as a human endeavour and curriculum outcomes of Stage 3 & 4. Students work in collaborative research teams, using a Scientific Investigation Form to undertake Fair Tests, guiding them to make predictions and record their methods, observations and results. A website supports student and teacher learning and provides a platform to promote water science interest, understanding and engagement well past their visit to the Water Lab.
Quick MENU
Lab stations
Our Lab offers 7 stations.
Please select a station for more info
1
2
3
4
5
6
7
Station 1 - Make it rain
Students are challenged to reflect on the basic processes of the water cycle i.e. evaporation & condensation as they make a cloud and attempt to harvest precipitation. They use a fog machine, a variety of containers and cold surfaces e.g. mirrors & ice.
Download:
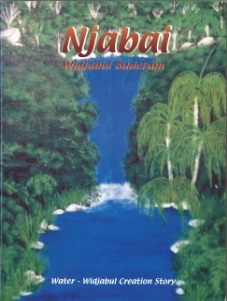
Station 2 - “Njabai” and indigenous fishing
Students read Njabai: Widjabul Buderam (Water: A Widjabul Creation Story) before they visit the lab and discuss its main concepts about indigenous water use and conservation. “Water is the most precious gift that we have had and still must be used sparingly to help everything that lives for future generations”, Aunty June. At the Lab students propose a hypothesis regarding the action of native plant material used in indigenous fishing. They prepare some leaves, seeds or bark and test it for its effect on water e.g. soapy lather, surface tension or dissolved oxygen. They conclude whether these are real effects or whether some other mechanism is responsible. This Station also demonstrates the application of scientific knowledge from indigenous people to the current day.
Download:
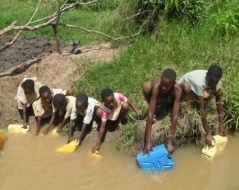
Station 3 - Dirty water
Students test the turbidity of a ‘dirty’ sample (a turbid sample which is analogous to polluted water). They then use a hand held carbon microfilter to purify the sample, re-testing and reflecting on the differences. Connections can be made to the difficulty of 10% of the world’s population in accessing clean drinking water. Students choose from a variety of natural and artificial materials to design a filter, test a turbid sample and compare results.
Download:
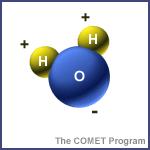
Station 4 - States of water
Students have watched ‘the water molecule’ video pre-visit and/or have a preliminary understanding that H20 exists in nature as a solid, liquid and gas, depending on the water molecules level of agitation and proximity to one another. At this station they heat a block of ice in a clear kettle predicting, observing and considering the changes in solid, liquid and gaseous water states. Students use a data logger to record and graph the temperature.
Download:
Station 5 - Sea to Fresh Water
Students use an Evaporative Still to convert seawater to freshwater. First they predict what they think will happen in the Still. They then measure the salinity of the seawater before and after it is boiled and relate this to the processes of the water cycle.
Downloads:
Station 6 - Which water?
Students observe unknown water samples (e.g. dam, rain, town, bore or seawater) and predict which water they think is which. They then analyse the samples for pH, salinity and turbidity and compare and contrast them to known samples. The students reflect on their predictions and the test results and attempt to explain the differences between the water types.
Download:
Station 7 - Groundwater
Students predict how far down they think the water table is at the Water Lab bore and use a depth gauge to measure and record the ground water height. They then enter their results into the Water Lab Groundwater Record Sheet and relate this to weekly rainfall data using the wireless weather station. With a hand pump the students collect a groundwater sample and compare chosen parameters (e.g. electrical conductivity, pH) to a rain water sample, observing and considering the differences.
Download:
